[Animated cover: Zero, the agent’s mascot, waves at the centre; around it orbit a DataCard «You are here», a notification, the bell, the star, a search and the OEE]
Zerynth helps Italian manufacturing SMEs move to Industry 4.0, with a platform that collects and shows data from production machines. Daniele Mazzei, my thesis supervisor and the company’s CTO, and Roberto Figliè, a PhD student, asked me to explore how a conversational agent could fit into their dashboard.
02 · The problem
Finding the data takes time, and nobody wants to learn the interface
Large companies
Custom dashboards and dedicated analysts
Italian SMEs
Plug-and-play packages, without the skills to make the most of them
In SMEs what matters is acting: preventing a breakdown, deciding on an investment. When the data can’t be found, people go back to pen, paper and Excel [1].
03 · The opportunity
How can an AI agent be built into an industrial dashboard so people decide faster, without having to learn it?
04 · The solution
Zero: the assistant that knows the dashboard and takes you straight to the data
[Video: a request for three data; Zero searches and answers with three DataCards, opens the first page beside the chat with the data lit; a click on the other cards changes the page and the data; «Nuova chat» starts again]
Find what you’re looking for
A question becomes a direct link to the data, filters already applied. With several requests, the first result opens by itself.
[Video: in Zero’s answer, a click on a DataCard’s star opens «Aggiunto ai preferiti» (page, relative or absolute period, name); «Fine» saves it and the star stays full]
Save the data you use often
One click saves the data to favourites, ready for next time.
[Video: a notification pop-up, a click on "Explain", the chat opening with the explanation]
Get the notifications that matter
One click opens the data. “Explain” calls the agent for the context.
05 · Key design moments
The design choices, within three fixed constraints
The design followed three constraints, set with Roberto.
1
Use an AI agent.
2
Let people find the data without learning the dashboard.
3
Make the agent reliable, because in a decision a mistake is costly.
A plain chat interface wasn’t enough on its own, because to understand quickly what is wrong with a stopped machine, visualisation remains irreplaceable. So two things were needed, that the user could ask and that the system could warn them first.
Roberto introduced me to mixed initiative, where the work is shared between person and system. In delegation the user asks the agent for what is long or repetitive; in proactivity the system takes the initiative when something needs attention. An agent built on an LLM suited both roles, because it understands a request however it is written and can explain a data point.
Notifications
Proactivity: notifications that explain themselves
The problem: Sometimes the user doesn’t know there is a problem, or that something is about to break, until something stops.
Zerynth already wanted to bring its alert emails into the dashboard, and it was the chance to give the system the initiative.
Decision: A notification leads straight to the data; “Explain” has the agent cross the trigger with other data, and it suggests a cause you can check.
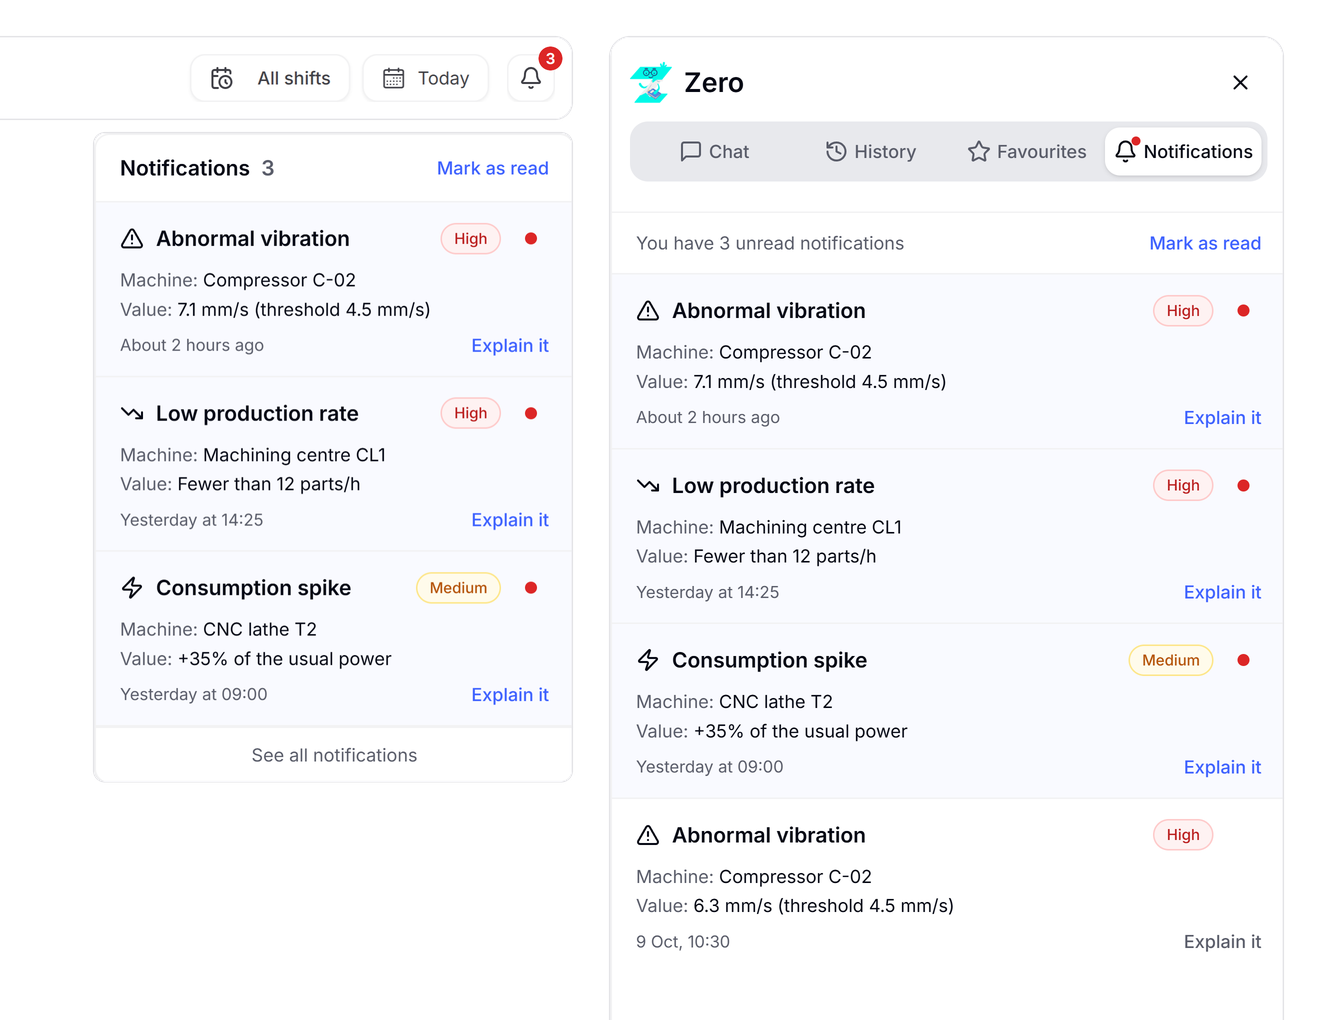
[Image: Notifications in two places: the bell’s popover in the header and the notification centre in Zero’s panel]
On the left, from the bell at the top, the latest notifications. On the right, in Zero’s sidebar, the full centre with every notification.
DataCard
Delegation: the DataCard, a direct link to the data
The problem: What is the user’s real need that can be delegated to an agent?
First attempt: At first I thought that, if the user doesn’t know how to use the dashboard, it had to be taught to them.
I was wrong, and a call with Zerynth’s PM made it clear. The user doesn’t want to learn, they want the data to decide.
[Video: the six versions of the DataCard arrive one at a time and stack up: the wireframe with the breadcrumb trail, the pill, the arrow, the bookmark with the filter, the favourite «Go there», finally the star with «You are here».]
01 · Wireframe: A tutorial: the breadcrumb trail leads to the data.
02 · High fidelity: The trail becomes a pill above the card.
03 · High fidelity: A single arrow leads to the data.
04 · High fidelity: The bookmark saves it; the period becomes a filter.
05 · High fidelity: Once saved, it lives among the favourites: name and «Go there».
06 · Final idea: The star saves it, «You are here» tells you where you are.
Decision: Version after version, the DataCard lost everything that explained the way: the path, the arrow, «Go to». What remained is a link: one click and you are on the data the agent found on the dashboard, the same one a notification opens.
Automatic Filters
Spotting and solving the pile-up: automatic filters
The problem: Now, though, useful DataCards end up in favourites, and favourites pile up.
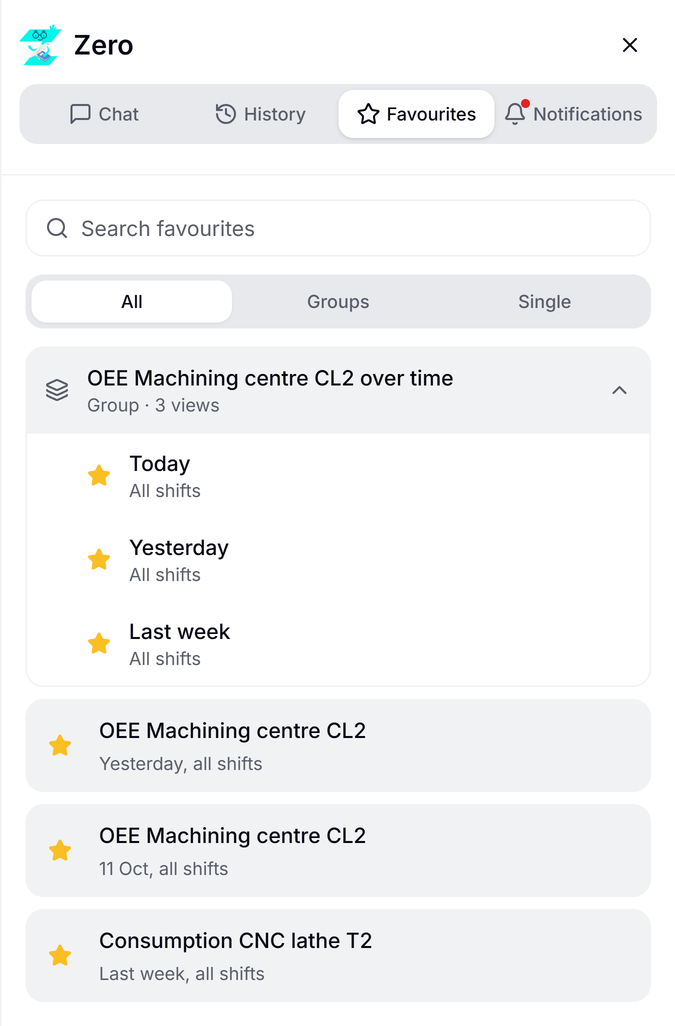
[Image: the favourites section with a search bar, and the smart groups version]
First attempt: The first ideas: a search bar in favourites, which brought back the original problem, and Smart Groups, which gather similar DataCards by themselves. Too much, for an MVP.
Decision: With the team we cut the problem at its root, giving every DataCard a relative or an absolute filter.
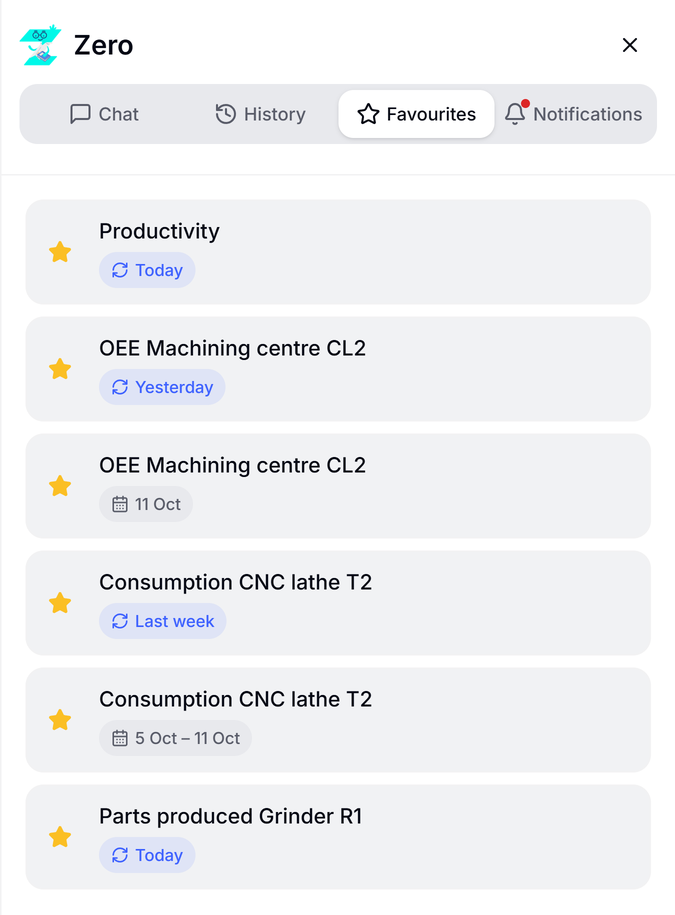
[Image: Favourites with their saved period: “Yesterday” and “Today” update (relative), “10 Oct” and “28 Sep – 4 Oct” stay fixed (absolute)]
“Yesterday” updates every time it opens. “10 Oct” stays fixed for good.
A relative card serves every day, without saving a new one. Smart Groups stay postponed, not dropped.
Reliable AI
Building a reliable assistant in complex systems
The problem: How can I be sure the agent tells the truth?
Decision: The dashboard is the only source. The agent doesn’t generate free answers but selects from a known schema, so every DataCard points to real data.
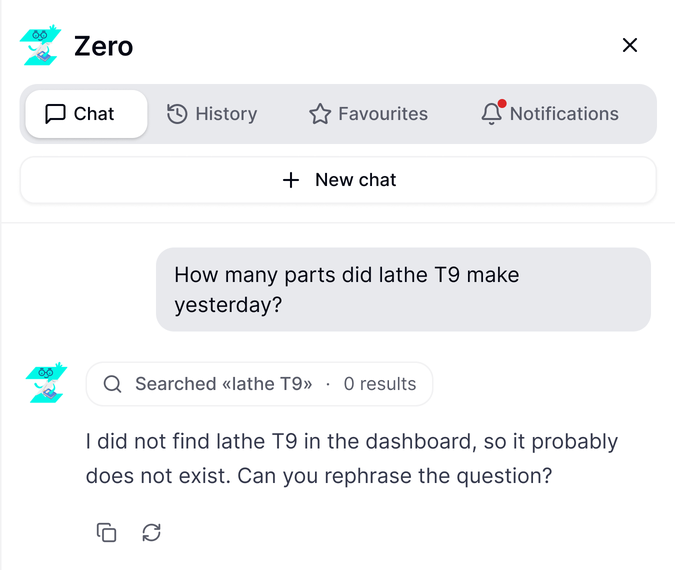
[Image: the agent’s message when it can’t find a data point, "I couldn’t find it, it probably doesn’t exist" + a request to rephrase]
If it finds no match (0 results), it says so and asks you to rephrase, instead of making something up.
The price: sometimes it finds nothing where an expert would get there alone. I chose reliability over coverage, because an error hidden in an automatic analysis is worse than raw data left to the user’s judgement.
“Select, don’t generate” is the heart of the Bounded-and-Integrative Approach, the framework published at TRUST‑CUA @ IUI 2026.
06 · Impact of the work
Impact of the work
For newcomers, finding a data point drops from 50 to 10 seconds [note 1]; experts need 10-15 [note 2]. Notifications explained by the agent made it into the final product, and the work became a published paper at the TRUST‑CUA @ IUI 2026 workshop [note 3].
1Pilot test with 3 people new to the interface, without statistical validity: first without the agent, then with it, so part of the gain may be first-time learning. It points to room for a structured test.
2Batch data retrieval, measured in functional tests. Not tested with expert users.
3Zero: Towards Reliable Agentic UX for Industrial Dashboards, with Roberto Figliè, Tommaso Turchi and Daniele Mazzei.
07 · What I’d still change
What I’d still change
I would have structured the test.
First time to get used to the interface, then the same search without the agent, to tell the gain apart from first-time effects.
I would have documented minor decisions as I made them.
Some got lost, despite extensive notes.
08 · What I learned
What I learned
Outside input improves an idea before you even know whether it’s right or wrong.
I tested ideas on my own, AI included, then with Roberto. The soundest decisions, the call with the PM above all, came from that double round.
An idea that is too ambitious has to be scaled to the constraints.
With Roberto I learned to scale down architectures that were too big at once, not once the work was under way.
09Re, re, re… redesign!
A year and a half later, I made it better
A year and a half later, I wanted to reimagine my designs with fresh eyes. The dashboard is the same, with the same data, but it now looks cleaner.
[Video: the right edge of the delivered dashboard, with the bell in the header and Zero’s floating button; the bell and the button leave, the dashboard widens to make room for a slim column, they come back into it and chat, history and favourites appear in between; then it goes back]
01
The agent’s bar
The floating button and the bell set off walking, until they met again in the same column: slim, always visible, next to chat, history and favourites.
BeforeAfter
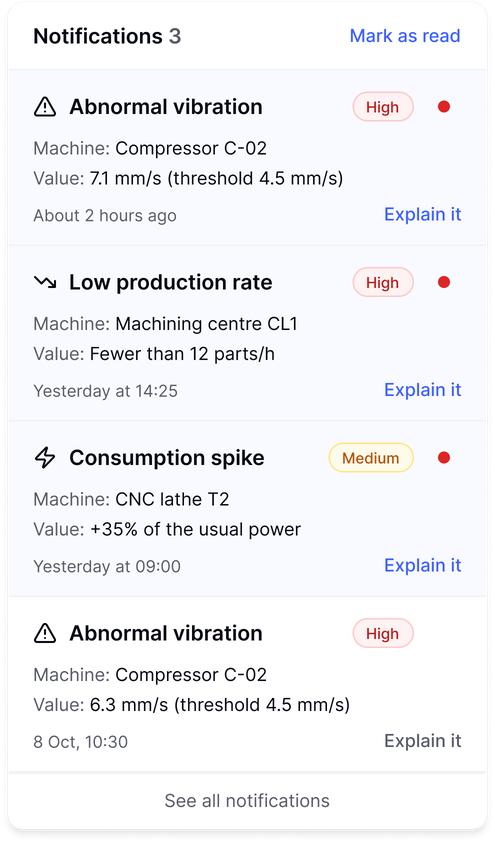
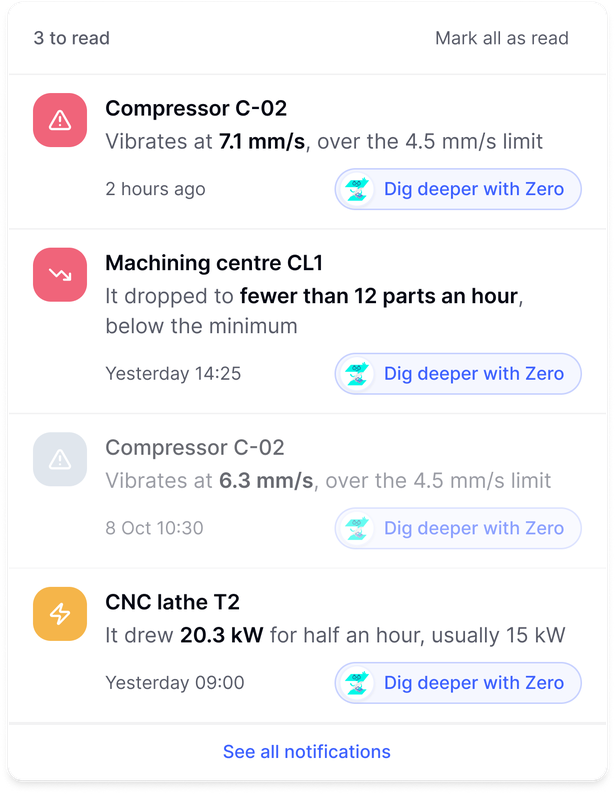
[Before: The delivered notifications: type, priority badge, red dot, Machine and Value rows, “Explain it”. After: The redesigned notifications: machine first, value in bold inside the sentence, priority as colour, “Dig deeper with Zero”.]
02
Notifications
The title is now the machine. The kind of problem is told by the icon and by the sentence that explains it, with the value inside. For priority, the colour is enough.
BeforeAfter
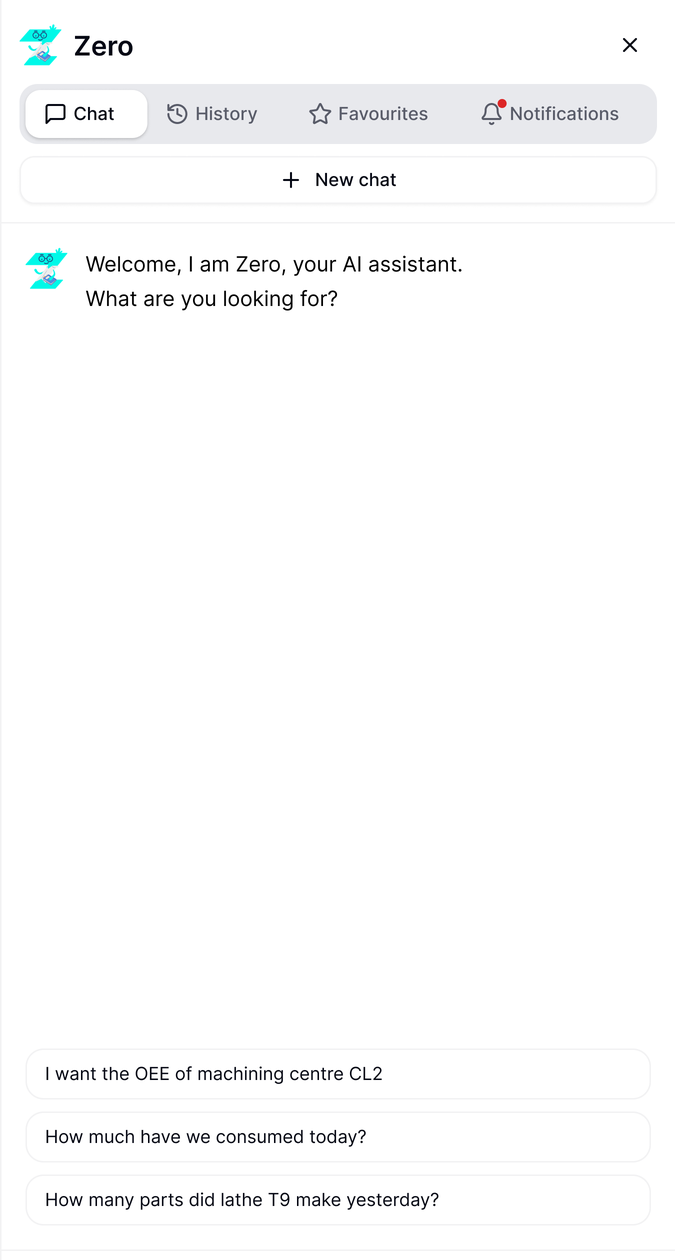
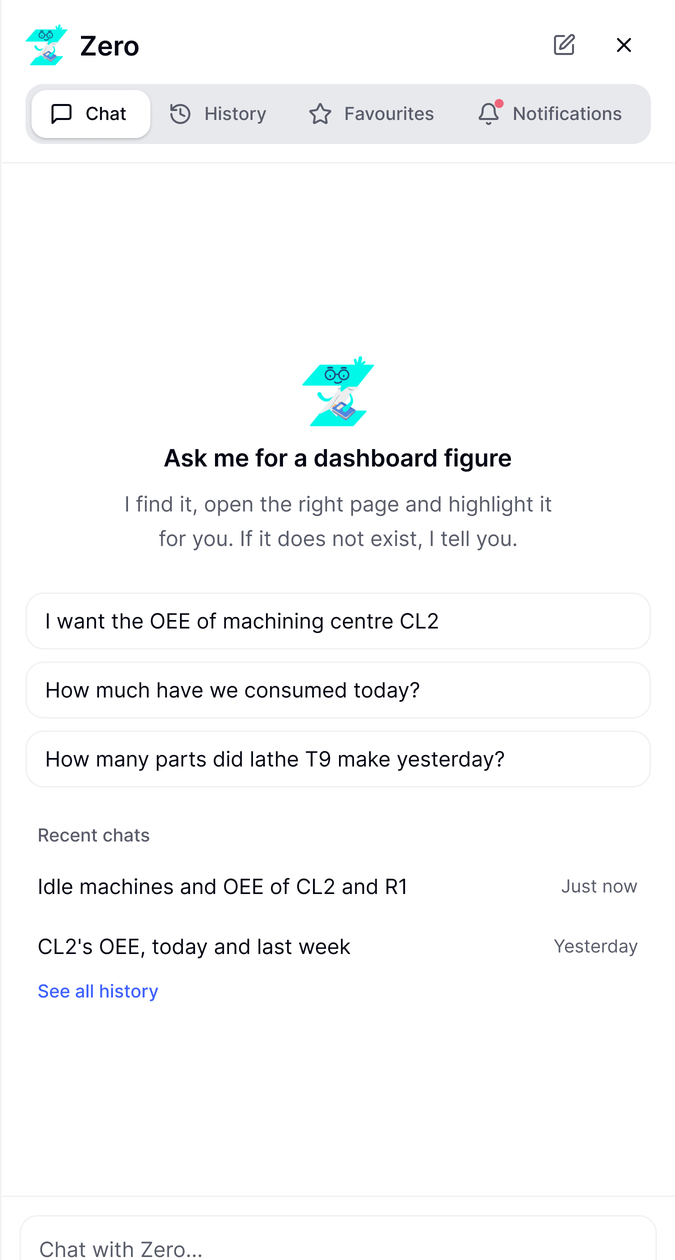
[Before: The delivered welcome: a greeting and three questions at the bottom of the panel. After: The redesigned welcome: what Zero does, three questions, recent chats.]
03
The welcome
The introduction takes more room and offers starting points, or recent chats. The menu at the top is redone too: «New chat» moves up and the icons breathe more.
[Video: Zero’s answer in the chat with the view’s card; «Apri vista» opens it; the four blocks (OEE, comparison, status, consumption) fly in from outside and land in the view, each with its source; the X closes it]
04
The composed view
I had set it aside during the project. When I had the time and the means I gave it a shape, to show what it was meant to be: when the question asks for analysis, Zero brings data from several pages into one view, each with its source.